The 12 Metro Areas That Are the Most Revved Up About Cars
BY WIKILAWN | APRIL 13TH, 2019 | BLOGBy John Egan
The more than 4.5 million residents of the Riverside-San Bernardino, CA, metro area are driven to drive.
A WikiLawn review of U.S. Census Bureau data shifts Southern California’s Riverside-San Bernardino metro area into the highest gear when it comes to major metro areas that are the most revved up about cars.
Now, you might be wondering why we care about cars so much. Well, as a lawn care company, we’re a little curious about which metro areas have garages crammed with cars rather than lawn care equipment.
Research Methodology
To come up with this ranking, we looked under the hood at data from the the Census Bureau’s 2013-2017 American Community Survey. Once there, we crunched data for the 50 largest U.S. metro areas in two categories:
- Occupied housing units.
- Occupied housing units with at least three vehicles.
We then figured out the percentage of occupied housing units that have at least three vehicles, defined by the Census Bureau as cars, pickup trucks, SUVs or vans. Riverside-San Bernardino — known as the Inland Empire — parked in the No. 1 spot, with nearly 28.4 percent of occupied housing units (mainly houses, apartments and condos) having at least three vehicles.
We limited our analysis to the 50 largest metro areas in the U.S.
What is it about California?
Matt DeLorenzo, senior managing editor at Irvine, CA-based automotive valuation and research company Kelley Blue Book, attributes Riverside-San Bernardino’s place atop the ranking, at least in part, to its location between the sprawling Los Angeles metro area and the mountains and deserts of Southern California.
“People in this area most likely have a lot of toys, ranging from off-road vehicles and motorcycles to boats and campers,” DeLorenzo says. “So they need vehicles for towing or getting to their preferred weekend activities.”
As for five of our top 12 being in California, DeLorenzo offers a one-word explanation: geography.
“California has big urban areas that are somewhat served by mass transit, but the main people movers are cars, trucks and SUVs,” he says.
In 2017, nearly 25.5 million automobiles were registered in California, according to the state Department of Motor Vehicles. Almost 2 million cars and pickup trucks were expected to have been sold throughout the state in 2018, the California New Car Dealers Association says.
A 2003 article in the New York Times noted that California reigns as the No. 1 automotive market in the state, considering that it’s also the biggest state in terms of population.
California’s car culture has been cultivated since the 1950s, the article said.
“Californians do not cruise much anymore, nor do they hang out at drive-ins, and parking is generally not allowed on the beaches,” the article pointed out. “Still, the car culture persists because drivers continue to spend a lot of time sitting on freeway on-ramps, imagining they could be doing these things instead of waiting … to join the herd on Interstate 5.”
With Riverside-San Bernardino racing to the lead position, here’s our ranking of the 12 Metro Areas That Are Most Revved Up About Cars.
1. Riverside-San Bernardino, CA
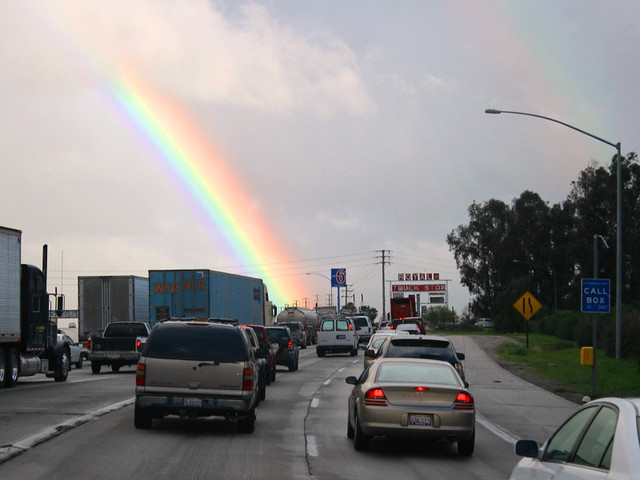
Occupied housing units: 1,335,366
Occupied housing units with 3+ vehicles: 378,794
% of occupied housing units with 3+ vehicles: 28.37%
2. San Jose, CA

Occupied housing units: 647,891
Occupied housing units with 3+ vehicles: 174,268
% of occupied housing units with 3+ vehicles: 26.90%
3. Richmond, VA

Occupied housing units: 479,256
Occupied housing units with 3+ vehicles: 123,195
% of occupied housing units with 3+ vehicles: 25.71%
4. Salt Lake City, UT

Occupied housing units: 382,620
Occupied housing units with 3+ vehicles: 98,057
% of occupied housing units with 3+ vehicles: 25.63%
5. Nashville, TN
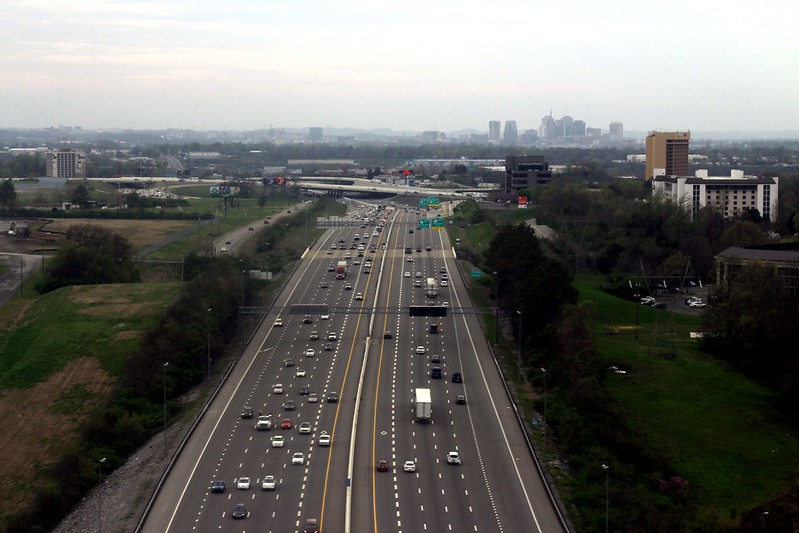
Occupied housing units: 691,266
Occupied housing units with 3+ vehicles: 164,594
% of occupied housing units with 3+ vehicles: 23.81%
6. Birmingham, AL
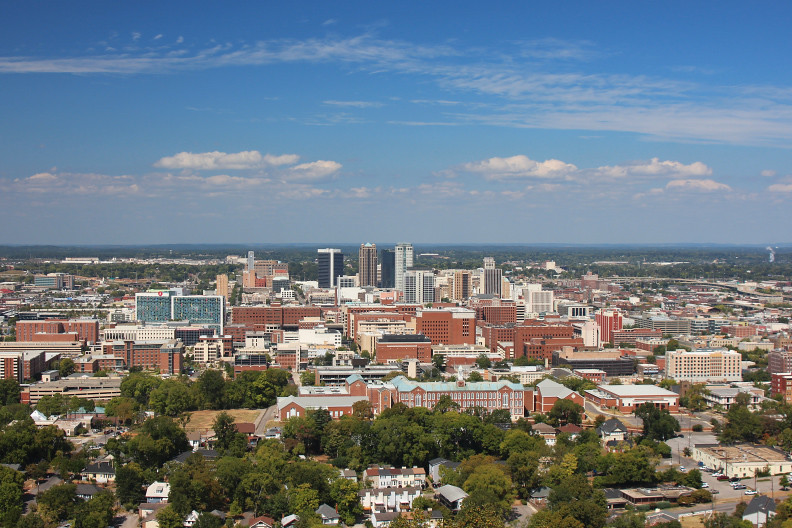
Occupied housing units: 440,261
Occupied housing units with 3+ vehicles: 104,514
% of occupied housing units with 3+ vehicles: 23.74%
7. San Diego, CA

Occupied housing units: 1,111,739
Occupied housing units with 3+ vehicles: 260,552
% of occupied housing units with 3+ vehicles: 23.44%
8. Sacramento, CA
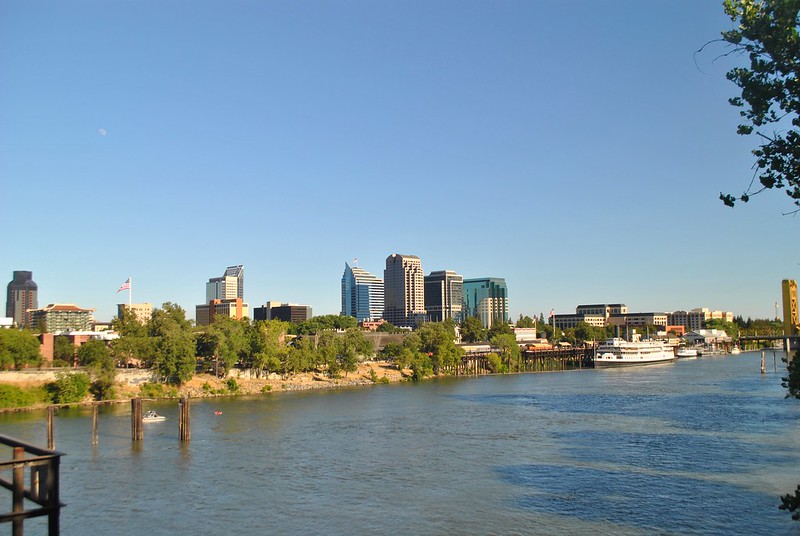
Occupied housing units: 811,543
Occupied housing units with 3+ vehicles: 187,149
% of occupied housing units with 3+ vehicles: 23.06%
9. Denver, CO
Occupied housing units: 1,075,807
Occupied housing units with 3+ vehicles: 244,836
% of occupied housing units with 3+ vehicles: 22.76%
10. Virginia Beach-Norfolk-Newport News, VA

Occupied housing units: 638,027
Occupied housing units with 3+ vehicles: 145,090
% of occupied housing units with 3+ vehicles: 22.74%
11. Charlotte, NC
Occupied housing units: 906,355
Occupied housing units with 3+ vehicles: 202,932
% of occupied housing units with 3+ vehicles: 22.39%
12. Los Angeles, CA
Occupied housing units: 4,320,174
Occupied housing units with 3+ vehicles: 966,163
% of occupied housing units with 3+ vehicles: 22.36%
Interested in this data? Here’s our Data Visualization:

Top Photo: Flickr // Kelly Hobbs
Author Bio: John Egan is a freelance writer who covers everything from personal finance to lawn care. His masterful work has been featured in The Huffington Post, Forbes, and The Guardian.